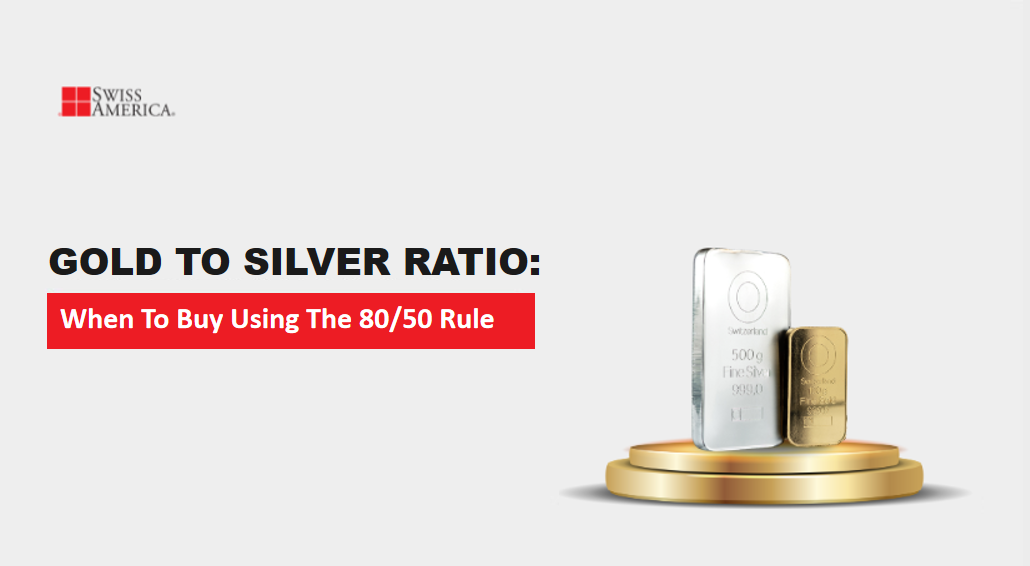
The gold to silver ratio is 69. And the 80/50 rule is the simplest way to use it. Buy silver when the ratio climbs above 80:1, and buy gold when it drops below 50:1. Anything in between those two levels is a normal range.
Knowing when to buy is one of the oldest timing tools in precious metals investing. This guide covers what the ratio is, what today’s reading signals, and how to use it to decide between gold and silver.
The 80/50 rule: buy silver when the ratio rises above 80:1, and buy gold when it drops below 50:1. Anything in between is a normal range. The current ratio is about 69:1.
What Swiss America customers chose in 2025
In 2025, 51% of Swiss America customers chose gold and 48.5% chose silver. Gold IRAs made up 21% of all Swiss America sales that year.
- Gold vs. silver in 2025: 51% of Swiss America customers chose gold, 48.5% chose silver
- Gold IRAs in 2025: 21% of all Swiss America sales
What is the gold-to-silver ratio?
The gold-to-silver ratio is how many ounces of silver it takes to equal the price of one ounce of gold. Precious metals investors use it to figure out when to buy gold versus when to buy silver.
- Formula: gold price ÷ silver price = ratio
- Gold is trading at ... per ounce and silver at ... per ounce, which works out to 69.
- A higher ratio (80:1 or 100:1) means gold is expensive relative to silver. That’s often a good time to buy silver.
- A lower ratio (40:1 or 50:1) means silver is expensive relative to gold. That points to gold as the better buy.
Free Resource
Want this sent to you?
Call us for a free precious metals kit — no obligation.
What is the historical and current gold-silver ratio?
The ratio changes every day based on economic conditions and the precious metals market. The historical figures below reflect published ratio data. Here are the changes over time:
| Period | Ratio |
| Historical average | 60:1 to 65:1 |
| 1980s to 2010s typical range | 40:1 to 60:1 |
| COVID extreme (March 2020) | 124:1 to 126:1 |
| April 2025 extreme | 105:1 |
| Early 2026 low | ~57:1 |
| Current | 69 |
These historical readings come from Investopedia, which tracks a long-run average near 65:1 since the 1970s, and Macrotrends ratio charts.
Why does the gold and silver ratio matter?
The ratio shows you when one metal is relatively cheap compared to the other. Gold and silver have different demand drivers. Investors, central banks, and people looking for a safe store of value buy gold.
Those looking for an investment that also has industrial demand should buy silver. About 60% of silver demand comes from industrial uses like solar panels, electronics, and manufacturing. The Silver Institute reported that silver industrial demand hit a record 680.5 million ounces in 2024. That makes it more sensitive to economic cycles and industrial growth.
What ratio signals a buying opportunity?
A ratio above 80:1 signals silver is undervalued and worth buying. Below 50:1 signals gold is the better value. That’s the 80/50 rule.
Here’s how to read the full range:
- Above 100:1: Silver is historically very cheap compared to gold. A strong signal to buy silver.
- 80:1 to 100:1: Silver looks attractive. A good time to add to your silver position.
- 50:1 to 80:1: A normal range. No strong signal either way.
- Below 50:1: Silver is expensive relative to gold. Gold is the better buy.
Some investors go further and shift their allocation as the ratio moves:
| Ratio range | Silver allocation | Gold allocation | Action |
| Above 100:1 | 50% to 60% | 40% to 50% | Aggressively buy silver |
| 80:1 to 100:1 | 45% to 55% | 45% to 55% | Buy more silver |
| 60:1 to 80:1 | 40% to 50% | 50% to 60% | Balanced approach |
| 40:1 to 60:1 | 30% to 40% | 60% to 70% | Buy more gold |
| Below 40:1 | 25% to 35% | 65% to 75% | Increase gold |
The ratio can stay at these levels for months or even years. Use it as one factor in your strategy, not as a perfect timing tool.
What moves the gold-to-silver ratio?
The ratio moves because gold and silver have different demand drivers. Gold is mostly an investment metal. Silver is both an investment and an industrial metal, so its price responds to investor demand and manufacturing demand at the same time.
According to Morgan Stanley, silver’s volatility can run two to three times greater than gold’s because the silver market is smaller. That creates bigger potential gains and bigger risks. When the economy expands, industrial demand for silver tends to increase. During economic uncertainty, investor demand picks up.
Conditions that favor silver buyers
Silver tends to be undervalued compared to gold in these situations:
- Geopolitical stress: During crises, investors buy gold as a safe haven. This pushes the ratio up and creates buying opportunities for silver.
- Economic recovery: When the economy grows, industrial demand for silver increases and the ratio compresses as silver catches up.
- Central bank buying: Central banks buy gold, not silver. When they increase gold purchases, the ratio climbs, and silver becomes more attractive.
- Supply deficits: Silver faces its sixth consecutive annual deficit in 2026, a 67 million-ounce shortfall reported by the Silver Institute. When supply can’t meet demand, it puts upward pressure on silver prices.
How do you use the ratio to decide what to buy?
You buy more of whichever metal the ratio says is cheap, then rebalance when the ratio swings back toward its average. A few approaches make this practical.
Mean reversion
The gold-to-silver ratio tends to revert to its historical average of around 60:1 to 65:1, a level Investopedia traces back to the 1970s. When the ratio spikes well above that average, silver looks cheap. When it drops well below, gold looks cheaper. Don’t rely on the ratio alone. Also weigh inflation expectations, interest rates, the strength of the dollar, and demand trends.
Portfolio allocation
A common guideline is holding 5% to 10% of your portfolio in precious metals. Within that, you might hold 35% to 60% in gold and 30% to 45% in silver, then adjust based on the current ratio and your risk tolerance.
Investment timelines
Your timeline can also change how you use the ratio.
- Long-term investors (5+ years): Buy at ratio extremes even when prices are volatile. Over time, the ratio tends to revert to its average, which works in your favor.
- Short-term traders (1 to 3 years): The ratio alone won’t give you precise timing. Active traders also watch the 200-day moving average and support and resistance levels, where the ratio has historically topped out between 100:1 and 126:1 and bottomed near 30:1 to 40:1, according to Macrotrends.
Recent example: 2025 to 2026
The ratio hit 105:1 in April 2025, then dropped to about 57:1 by early 2026. For full-year 2025, silver returned about 145% while gold returned about 63%, according to U.S. Global Investors‘ 2025 commodities returns. Silver’s outperformance across 2025 is what pulled the ratio down, a case of mean reversion after an extreme.
Don’t rely on the ratio alone
The ratio helps with timing, but it has limits. Analyst forecasts for silver in 2026 range widely, from about $44 on the bear case to $150 on the bull case, according to the International Precious Metals Institute (IPMI). That wide range means the ratio can move drastically.
Look at other factors like supply deficits, industrial demand, what the Federal Reserve is doing with interest rates, and geopolitical events. Don’t put too much of your portfolio into one metal just because the ratio looks compelling.
How do you apply the ratio to your own portfolio?
Start by calculating your own gold-to-silver split, then use the market ratio to guide your next purchase.
- Calculate your portfolio’s ratio: Divide the total value of your gold holdings by the total value of your silver holdings. This shows your current allocation, not just the market ratio.
- Track the ratio: Free online charts let you monitor it. Check weekly or monthly, depending on your timeline.
- Stick with low-premium forms: When you buy, choose 1-ounce coins and 10-ounce bars. These carry lower premiums and help you build your position without paying extra fees.
Final thoughts on the gold and silver ratio
The ratio is a rule of thumb for comparing the current gold price to silver and seeing which is the better relative value. It’s 69. Compare that to the 80/50 rule to see which metal, if any, is the better buy right now.
To learn more about adding physical gold or silver to help protect your financial future, connect with the Swiss America team today!
Gold to silver ratio: when to buy FAQs
How do I use the gold-to-silver ratio to rebalance my precious metals portfolio?
If you want to use it to rebalance, check the ratio against your current holdings:
- Calculate your split: Divide your gold value by your silver value to see where you stand today.
- Compare to target: If the market ratio is far from your target range, that’s your rebalancing signal.
- Trim, don’t dump: Shift a portion of the overweight metal rather than selling it all at once.
Why does the gold-to-silver ratio vary so significantly over time?
Gold and silver respond to different forces, so their prices move differently:
- Safe haven vs. industrial demand: Gold reacts to fear and central bank buying; silver reacts to solar, electronics, and manufacturing cycles.
- Market size: Silver’s smaller market makes its price more volatile.
- Policy shifts: Events like leaving the gold standard in 1971 reset the ratio’s baseline for decades.
Does the gold-to-silver ratio accurately predict future market trends?
No, it’s a value comparison, not a forecast of gold or silver.
- No fixed floor or ceiling: The ratio has swung from 17:1 to 125:1 in Macrotrends data, so extremes don’t guarantee a reversal date.
- Best paired with other signals: Supply deficits, interest rates, and industrial demand change the outcome as much as the ratio itself.
- Useful for timing, not certainty: It tells you which metal is relatively cheap right now, not what either will do next.
What ratio of gold to silver should I buy?
It depends on your goals, risk tolerance, and what the market ratio tells you right now. Most investors combine personal preference with market signals.
- Equal split (50/50): Balances exposure to both metals without trying to time the market. Works for investors who want simplicity.
- Gold-heavy (70/30 or 80/20): A more conservative approach that leans on gold’s stability and safe-haven reputation. Better for lower risk tolerance and less volatility.
- Market-based adjustments: Buy more of whichever metal the ratio says is cheap. Above 80:1, buy more silver. Below 50:1, buy more gold. This requires active monitoring and rebalancing.
Do investors buy more gold or silver?
Nearly equally. The split between gold buyers and silver buyers is close, and demand for each shifts with the ratio and with your own goals and risk tolerance. Both metals work for building a precious metals portfolio.
The information in this post is for informational purposes only and should not be considered tax or legal advice. Please consult with your own tax professionals before making any decisions or taking action based on this information.