Over the past forty-four years, Swiss America has helped our clients safely invest in gold and other precious metals. As we head into the remaining five months of 2026, we compared our year-to-date gold and precious metals sales data with the same period in 2025 to share gold demand trends and patterns. The goal is to help investors understand current trends and popular options.
So far, 2026 brings persistent inflation, with the Minneapolis Fed estimating 3.9% for the year. The current war with Iran, tariffs, housing costs, and the combined $756B in AI infrastructure spend all contribute to sustained investments in tangible assets like gold.
What our data includes
For our data analysis, we focused on sales data from January 2026 through July 2026 and compared it to the same timeframe for 2025. This included the date of purchase, the product purchased, and the shipping location. To streamline certain categories, we made the following consolidations in reporting:
Regions
We grouped state data into five regions:
Northeast
Maine, Massachusetts, Rhode Island, Connecticut, New Hampshire, Vermont, New York, Pennsylvania, New Jersey, Delaware, Maryland, and the District of Columbia.
Southeast
West Virginia, Virginia, Kentucky, Tennessee, North Carolina, South Carolina, Georgia, Alabama, Mississippi, Arkansas, Louisiana, and Florida.
Midwest
Ohio, Indiana, Michigan, Illinois, Missouri, Wisconsin, Minnesota, Iowa, Kansas, Nebraska, South Dakota, and North Dakota.
Southwest
Texas, Oklahoma, New Mexico, and Arizona.
West
Colorado, Wyoming, Idaho, Montana, Washington, Oregon, Utah, Nevada, California, Alaska, and Hawaii.
Size grouping
Precious metals bars and coins come in many different sizes and weights. We consolidated these into specific ranges, then focused our analysis on the five most popular:
- 0.1 to 0.25 oz
- 0.25 to 0.5 oz
- 0.5 to 1 oz
- 1 to 2 oz
- 5 to 10 oz
Key insights and highlights
Silver overtook gold at 55.3% of all purchases
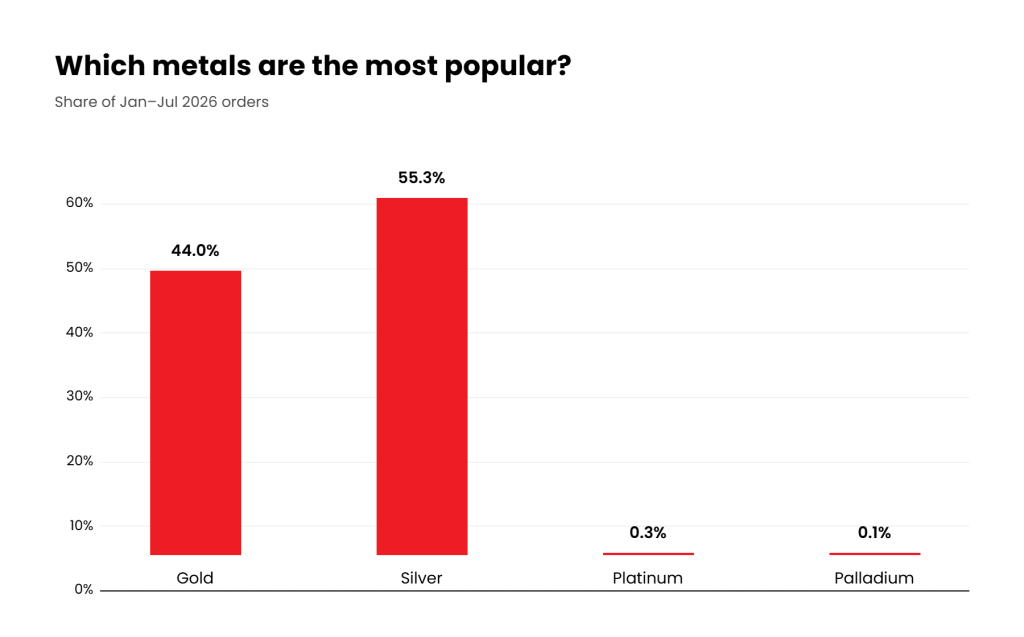
Silver was 55.3% of orders in January through July 2026, compared with 47.4% in the same period of 2025. Gold was 44.0%, compared with 52.1% last year.
Gold IRA buyers chose silver 74.4% of the time
Gold was 24.1% of Gold IRA orders and 47.0% of all other orders. Of every silver order placed, 16.7% went to a retirement account, compared with 14.9% last year.
78.9% of Gold IRA orders were 1 oz or larger, compared with 21.8% of all other orders
The 5 to 10 oz range alone accounted for 50.4% of Gold IRA orders and 4.5% of all other orders. The 0.25-0.5 oz range accounted for 4.5% of Gold IRA orders and 29.2% of all other orders.
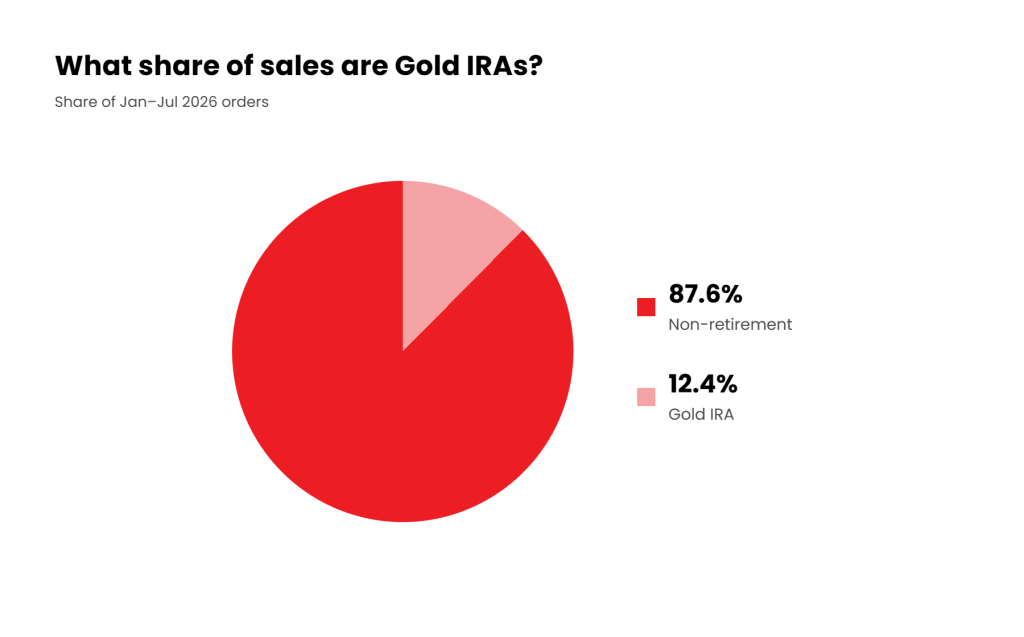
12.4% of all sales were for Gold IRAs
Gold IRA orders were 12.4% of all orders, up from 9.6% for the same timeframe in 2025.
Midwest purchases grew to 19.0%
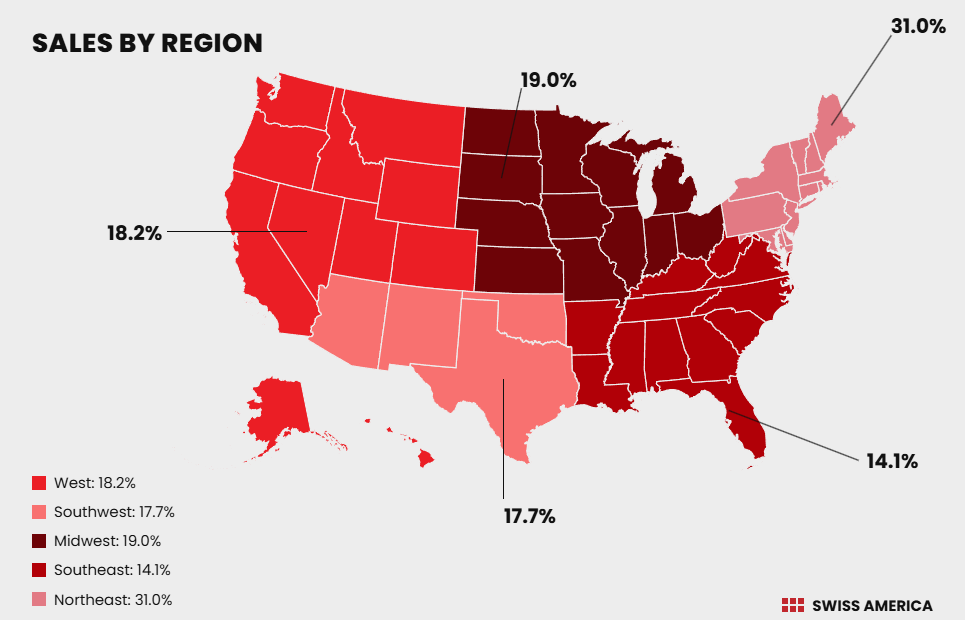
The Midwest was 19.0% of orders in January through July 2026, compared with 16.1% last year. The Northeast remained the largest region at 31.0%.
Free Resource
Want this sent to you?
Call us for a free precious metals kit — no obligation.
At-a-glance summary of data in Swiss America’s report
| Category | What it includes | Why it’s useful |
| Demand | Monthly sales patterns, coins vs bars, regional sales, and precious metal choices | Gives a picture of precious metals sales trends comparing Jan 1 – July 31 for both 2025 and 2026 |
| Products | Popular sizes and top-selling coins | Shows what investors bought the most |
| Gold IRAs | IRA usage, timing, and product choices | Explains retirement account trends and popular products |
What are Swiss America’s sales trends by month?
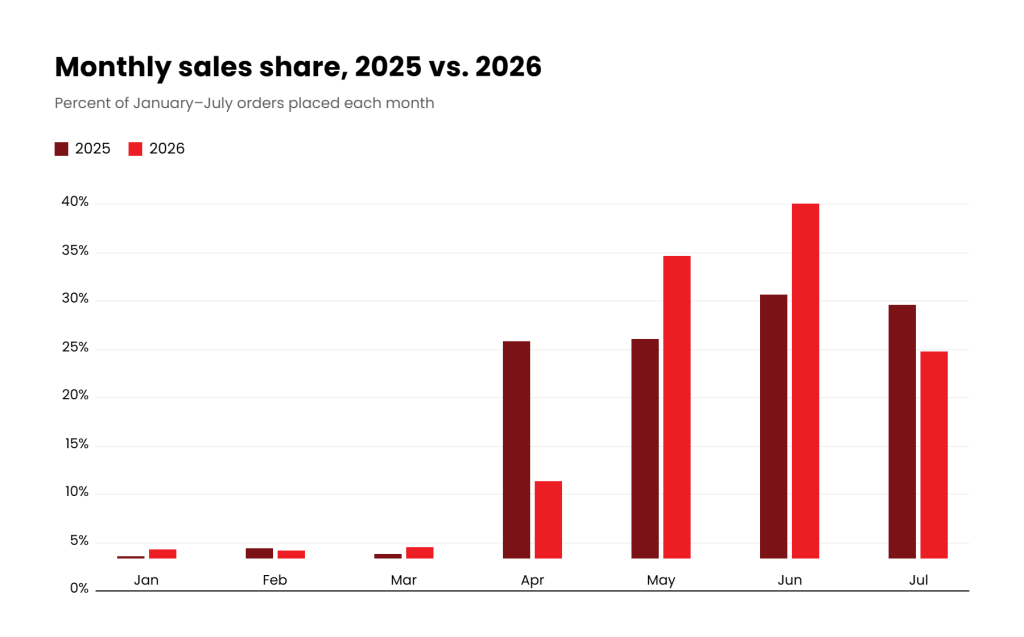
Just like 2025, gold and silver purchases tend to ramp up as the year goes on. April was 8.1% of Jan to Jul orders in 2026, down from 22.5% in 2025. May was 31.3%, up from 22.7%.
June was the highest month at 36.7%, up from 27.3%. July was 21.5%, down from 26.3%. January, February, and March each moved less than 1 point from the prior year.
- Jan: +0.7 pts
- Feb: -0.2 pts
- Mar: +0.7 pts
- Apr: -14.4 pts
- May: +8.6 pts
- Jun: +9.4 pts
- Jul: -4.8 pts
Are coins or bars more popular?
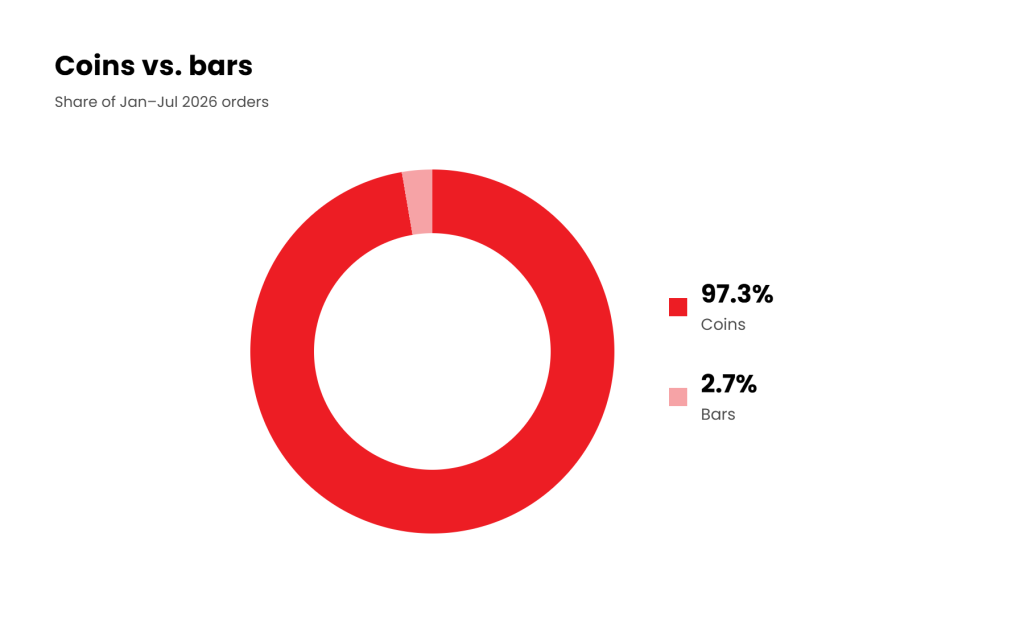
Do Swiss America customers buy more coins versus bars? Most customers bought gold or silver coins in 97.3% of orders in Jan to Jul 2026. This was slightly down from 97.6% in 2025.
Gold and silver bars were 2.7%, up from 2.4%.
- Jan to Jul, coins: 97.6% → 97.3%
- Jan to Jul, bars: 2.4% → 2.7%
Which regions buy the most precious metals?
The Northeast was the largest region at 31.0% of orders, down from 32.5% in 2025. One factor for the region’s overall share is that it houses Delaware Depository, one of the largest secure facilities holding Gold IRA metal.
For the other regions, the Midwest was 19.0%, up from 16.1%. The West was 18.2%, down from 19.4%. The Southwest was 17.7%, up from 17.1%. The Southeast was 14.1%, down from 14.8%.
- Northeast: 32.5% to 31.0%
- Midwest: 16.1% to 19.0%
- West: 19.4% to 18.2%
- Southwest: 17.1% to 17.7%
- Southeast: 14.8% to 14.1%
Which metals are the most popular?
Silver was 55.3% of orders in Jan to Jul 2026, up from 47.4% in 2025. The metal remains in a structural supply deficit, its sixth consecutive year, driven by strong investment demand for coins and bars.
Gold was 44.0% of all purchases, down from 52.1%. Platinum was 0.3%, and palladium was 0.1%.
- Gold: 52.1% to 44.0%
- Silver: 47.4% to 55.3%
- Platinum: 0.4% to 0.3%
- Palladium: 0.1% to 0.1%
What percentage of all Swiss America’s sales are for Gold IRAs?
Gold IRA orders were 12.4% of all sales in Jan to Jul 2026, up from 9.6% in 2025.
- Gold IRA: 9.6% to 12.4%
- Non-retirement: 90.4% to 87.6%
Which weights and sizes did customers buy the most?
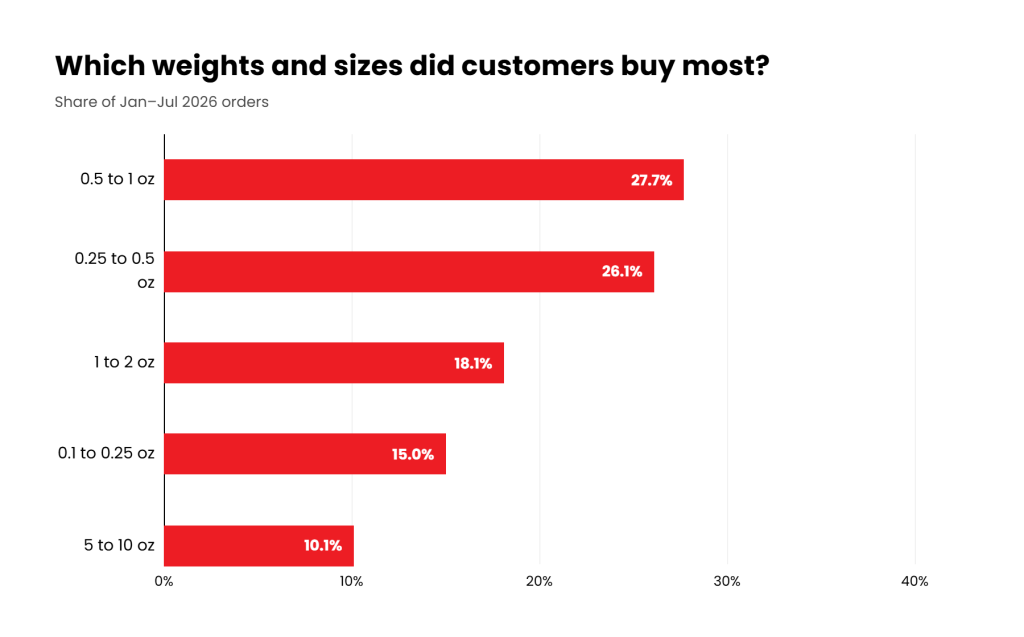
Precious metals come in different coin and bar sizes. The 0.5 to 1 oz range was 27.7% of orders in Jan to Jul 2026, down from 35.8% in 2025. The 0.25 to 0.5 oz range was 26.1%, down from 29.6%.
The 1 to 2 oz range was 18.1%, up from 15.2%. The 0.1 to 0.25 oz range was 15.0%, up from 11.9%. The 5 to 10 oz range was 10.1%, up from 5.9%.
- 0.5 to 1 oz: 35.8% to 27.7%
- 0.25 to 0.5 oz: 29.6% to 26.1%
- 1 to 2 oz: 15.2% to 18.1%
- 0.1 to 0.25 oz: 11.9% to 15.0%
- 5 to 10 oz: 5.9% to 10.1%
What are the top 5 most popular products?
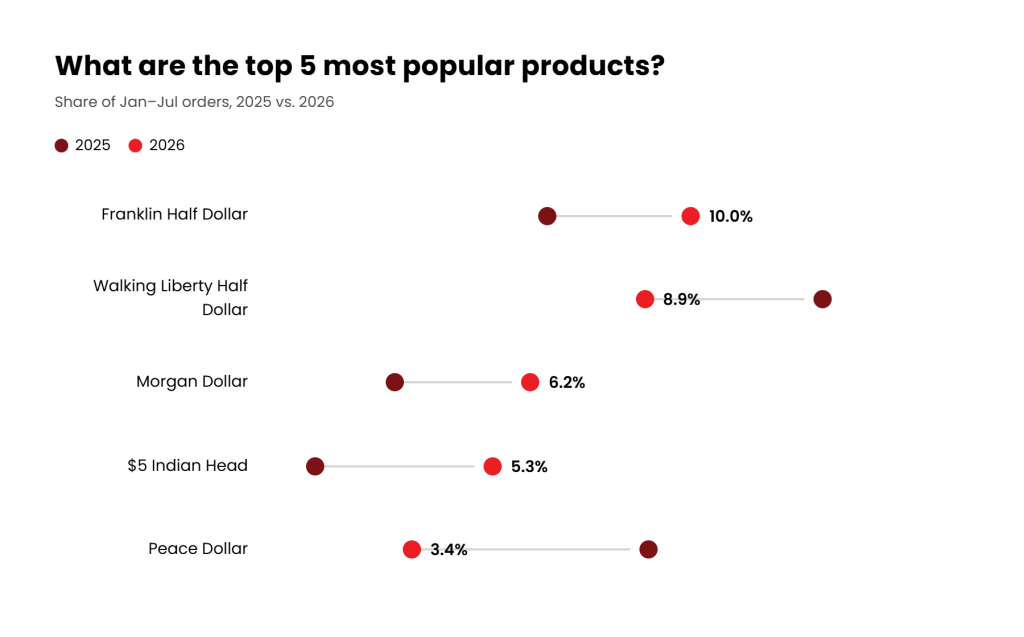
The top 5 products so far in 2026 are the Franklin Half Dollar, the Walking Liberty Half Dollar, the Morgan Dollar, the $5 Indian Head, and the Peace Dollar.
Two of these are new to the top five this year, the $5 Indian Head and the Morgan Dollar, replacing the Gold American Eagle Proof and the $10 Liberty Eagle.
- Franklin Half Dollar: 6.6% to 10.0%
- Walking Liberty Half Dollar: 13.1% to 8.9%
- Morgan Dollar: 3.0% to 6.2%
- $5 Indian Head: 1.1% to 5.3%
- Peace Dollar: 9.0% to 3.4%
When did buyers make Gold IRA purchases?
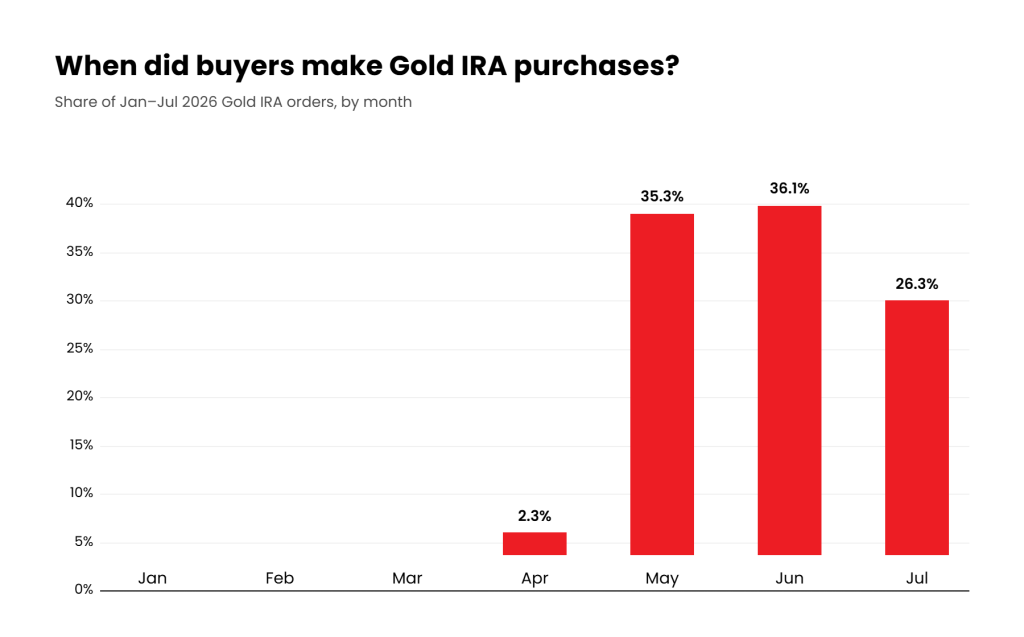
Gold IRA purchases were concentrated in Q2 both years. Q2 was 73.7% of Jan to Jul Gold IRA orders in 2026, up from 69.2% in 2025. July was 26.3%, down from 30.8%. Q1 was 0% in both years.
This overall pattern is consistent with Precious Metal IRA rollovers taking time to complete and tax season pulling attention toward other financial decisions early in the year.
- Q1: 0% to 0%
- Q2: 69.2% to 73.7%
- July: 30.8% to 26.3%
How are Gold IRA purchases distributed by size or weight?
You can buy Gold IRA-eligible precious metals in any size.
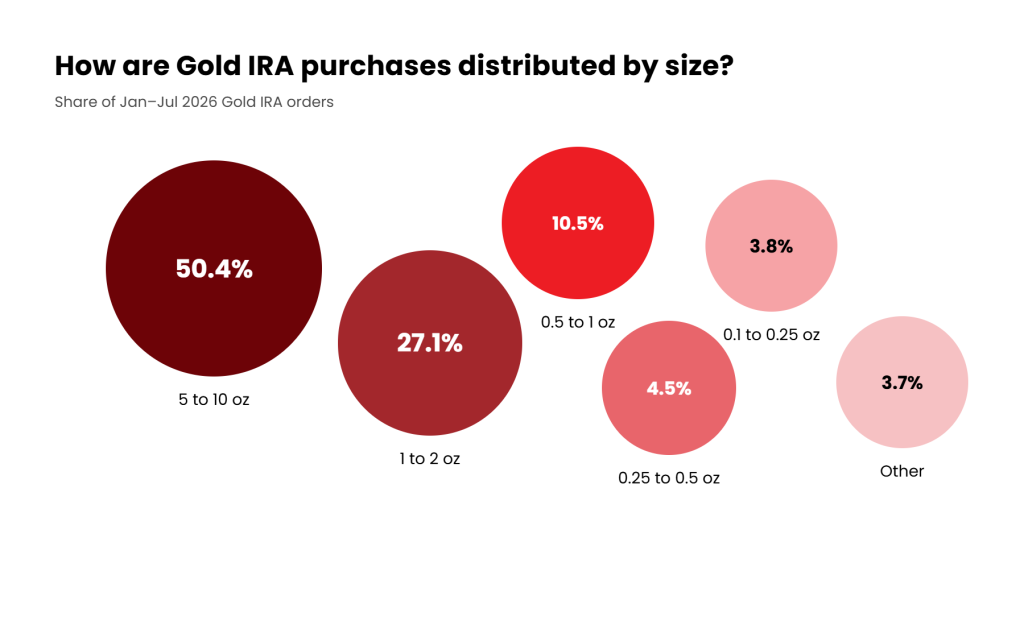
The 5 to 10 oz range was the largest size for Gold IRA orders in 2026, at 50.4%, up from 46.8% in 2025. The 1 to 2 oz range was 27.1%, down from 29.5%. The 0.5 to 1 oz range was 10.5%, down from 12.2%.
The 0.25 to 0.5 oz range was 4.5%, down from 7.7%. The 0.1 to 0.25 oz range was 3.8%, up from 3.2%.
- 5 to 10 oz: 46.8% to 50.4%
- 1 to 2 oz: 29.5% to 27.1%
- 0.5 to 1 oz: 12.2% to 10.5%
- 0.25 to 0.5 oz: 7.7% to 4.5%
- 0.1 to 0.25 oz: 3.2% to 3.8%
Do Gold IRA buyers choose different sizes for gold versus silver?
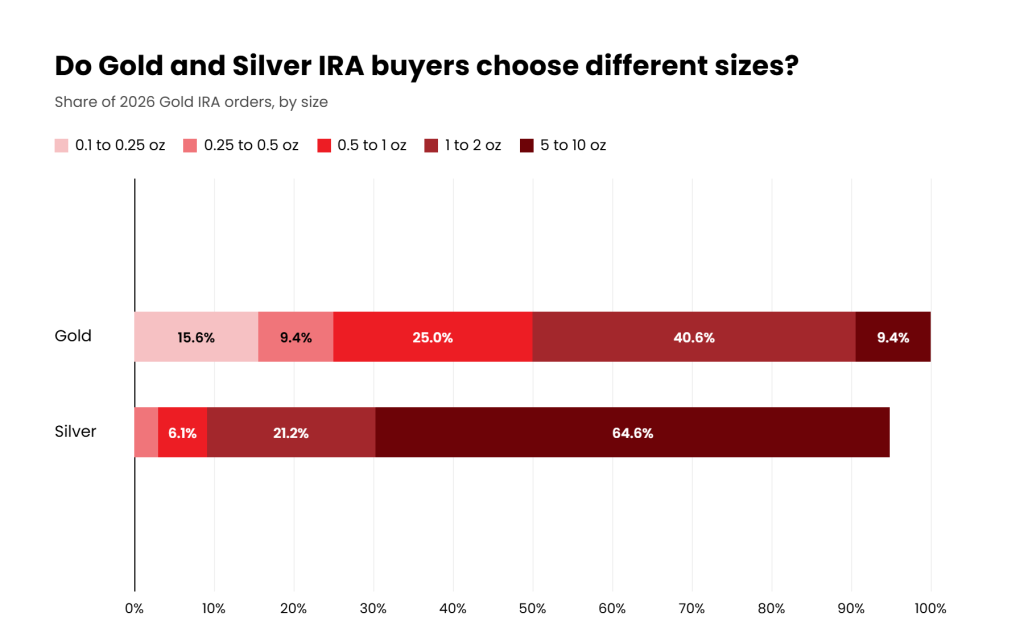
The price of gold is ... per ounce, so Gold IRA buyers lean toward smaller sizes. 1 to 2 oz was the top size in 2026 at 40.6%, similar to 39.0% in 2025.
Fractional sizes under 1 oz made up over half of gold purchases both years. Silver IRA buyers tend to purchase larger sizes. 5 to 10 oz was the top size at 64.6% in 2026, up slightly from 63.2% in 2025.
Gold
- Gold, 1 to 2 oz: 39.0% to 40.6%
- Gold, 0.5 to 1 oz: 24.4% to 25.0%
- Gold, 0.25 to 0.5 oz: 22.0% to 9.4%
- Gold, 0.1 to 0.25 oz: 12.2% to 15.6%
Silver
- Silver, 5 to 10 oz: 63.2% to 64.6%
- Silver, 1 to 2 oz: 25.4% to 21.2%
- Silver, 0.5 to 1 oz: 7.9% to 6.1%
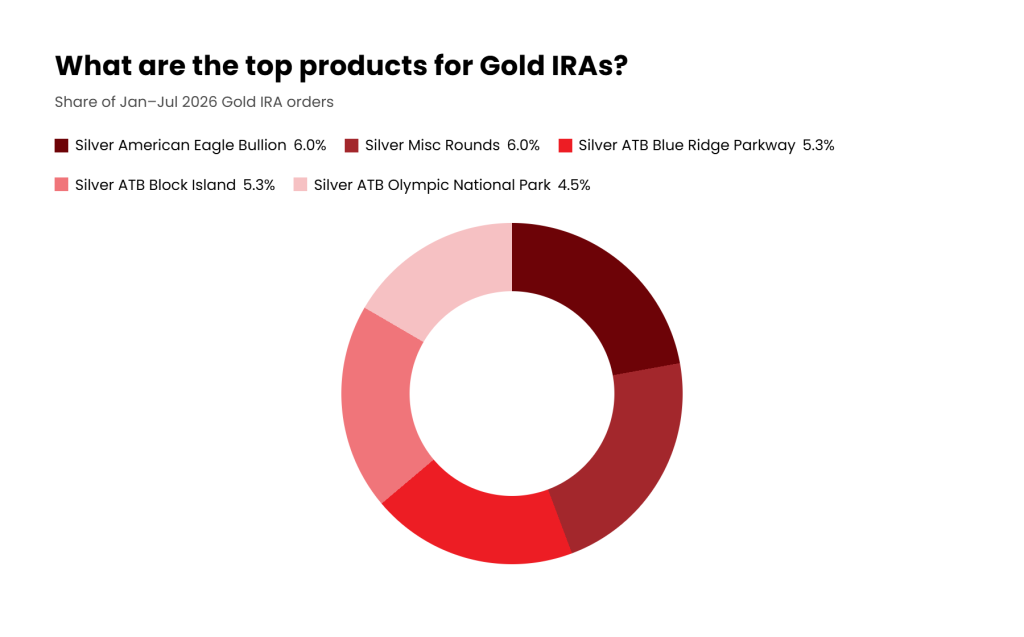
What are the most popular products for Gold IRAs?
Silver rounds and the Silver American Eagle Bullion held onto the top 5 from the same time period last year, now tied for the top spot at 6.0% each.
Three 5 oz silver America The Beautiful (ATB) coins are new to the top 5 in 2026: Blue Ridge Parkway and Block Island tied at 5.3%, and Olympic National Park at 4.5%.
- Silver American Eagle Bullion (1 oz): 3.2% to 6.0%
- Silver Misc Rounds (1 oz): 7.7% to 6.0%
- 5 oz Silver ATB, Blue Ridge Parkway: 0.6% to 5.3%
- 5 oz Silver ATB, Block Island: 1.9% to 5.3%
- 5 oz Silver ATB, Olympic National Park: 1.9% to 4.5%
Future outlook
For the remainder of 2026, purchasing patterns will likely follow what we see happening with the economy. If consumers continue to worry about inflation or the value of the dollar, investors may buy more of both metals as we close out the year. Key things to watch:
- Interest rates: The Federal Reserve will meet three more times in 2026 to decide monetary policy. If the agency decides to raise interest rates, gold demand will likely drop as investors seek higher-yield investments, such as bank savings accounts.
- Central banks: In 2025, central banks bought 863 tonnes of gold to protect their treasuries from a weaker U.S. dollar. This is about twice as much as annual purchases before 2021, which has increased global gold demand.
- Employment data: Each monthly BLS report indicates the health of the economy. If investors feel uncertain or worry about where things are headed, this also increases demand and price of gold and silver.
- AI sentiment: Global AI build-out continues to impact jobs, communities, and the stock market. If investors fear an AI-bubble correction, this will impact stocks and likely increase gold prices as investors seek safe-haven assets.
Leverage sites like the World Gold Council, the Silver Institute, and Swiss America’s blog and podcast to stay ahead of these changes and protect your portfolio.
About Swiss America
Swiss America was founded in 1982 and built a reputation as one of the most trusted precious metals firms in the country. Over the past 40 years, we’ve guided more than 70000 clients on using gold and silver to diversify their portfolios.
The company is well-known for its personalized approach, professional support, and commitment to investor education.
The information in this post is for informational purposes only and should not be considered tax or legal advice. Please consult with your own tax professionals before making any decisions or taking action based on this information.