So far, 2025 has been anything but smooth. Between trade wars, the six-week shutdown of the federal government, and a 20% drop in consumer sentiment, it’s no wonder that gold prices have risen more than 40% in the past year.
Meanwhile, the Federal Reserve has cut rates twice so far in 2025. Goldman Sachs forecasts two more 25-basis-point cuts in the first half of 2026. Lower rates usually drive gold demand, as competing safe-haven investments yield lower returns.
To better understand how this is unfolding in our corner of the market, we analyzed our sales data from January to October 2025. Our goal with our gold demand trends report is to share what we’re seeing and provide helpful context for the current market.
What our gold demand trends data includes
For our data analysis, we focused on sales data from January 2025 through October 2025. This included the date of purchase, the product purchased, and the shipping location. To streamline certain categories, we made the following consolidations in reporting:
Regions
We grouped state data into five regions:
Northeast
Maine, Massachusetts, Rhode Island, Connecticut, New Hampshire, Vermont, New York, Pennsylvania, New Jersey, Delaware, Maryland, and the District of Columbia.
Southeast
West Virginia, Virginia, Kentucky, Tennessee, North Carolina, South Carolina, Georgia, Alabama, Mississippi, Arkansas, Louisiana, and Florida.
Midwest
Ohio, Indiana, Michigan, Illinois, Missouri, Wisconsin, Minnesota, Iowa, Kansas, Nebraska, South Dakota, and North Dakota.
Southwest
Texas, Oklahoma, New Mexico, and Arizona.
West
Colorado, Wyoming, Idaho, Montana, Washington, Oregon, Utah, Nevada, California, Alaska, and Hawaii.
Size grouping of coins and bars
Precious metals bars and coins come in many different sizes and weights. We consolidated these into specific ranges, then focused our analysis on the five most popular:
- 0.1 to 0.25 oz
- 0.25 to 0.5 oz
- 0.5 to 1 oz
- 1 to 2 oz
- 5 to 10 oz
Free Resource
Want this sent to you?
Call us for a free precious metals kit — no obligation.
Key insights and highlights
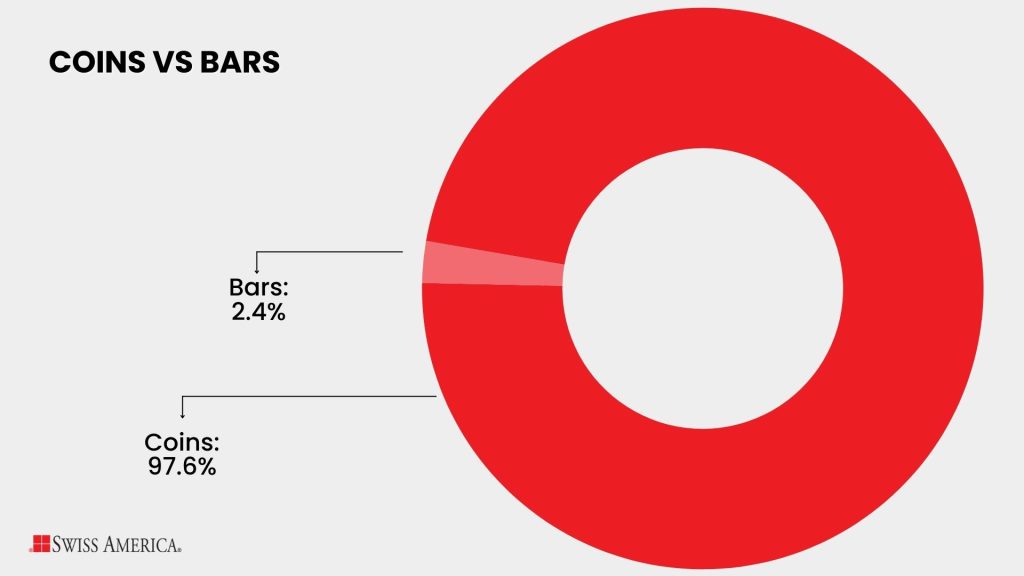
1) 97.6% of buyers choose coins over bars
Customers overwhelmingly chose coins at 97.6% of all sales, versus bars at 2.4%.
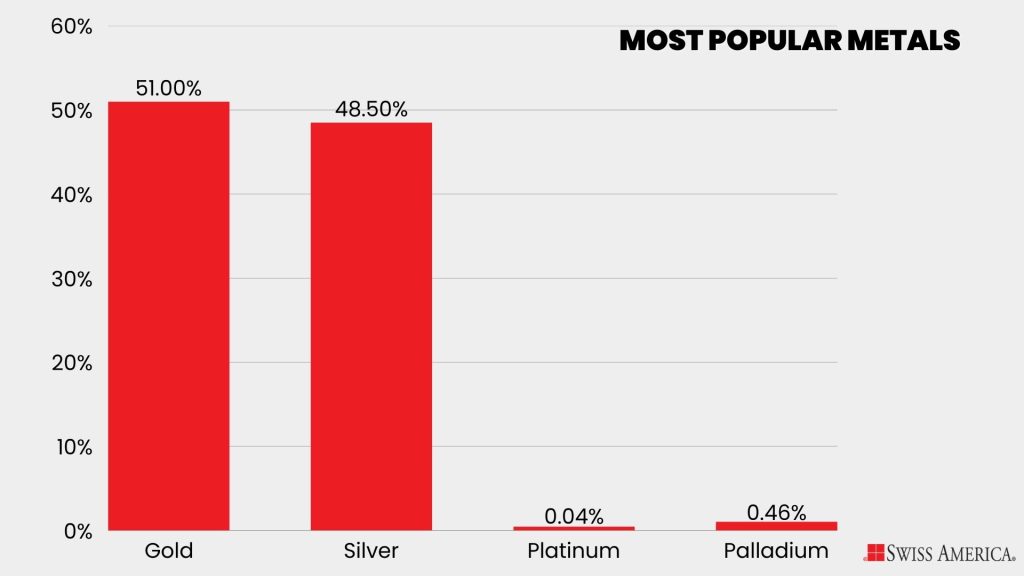
2) The majority of investors chose gold over other metals at 51%
Customer demand is almost even between gold and silver, with slightly more people choosing gold. Silver accounted for 48.5%, while platinum and palladium accounted for only a minimal amount of activity.
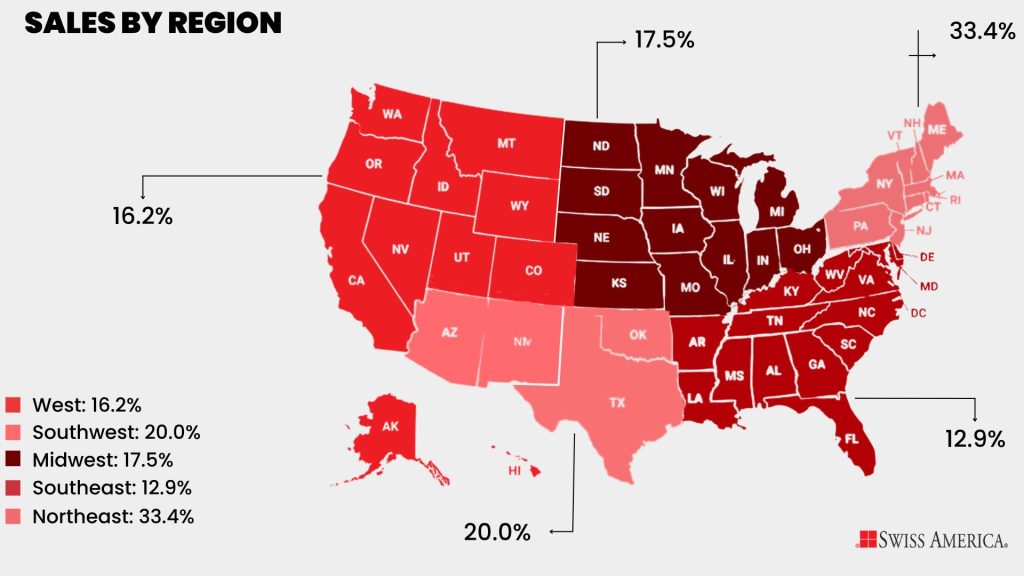
3) The Northeast region accounted for 33.4% of all sales
Buyers in this region had the highest share of orders across the country. The Southwest followed at 20%, while the Midwest, West, and Southeast made up the remaining portions of national demand.
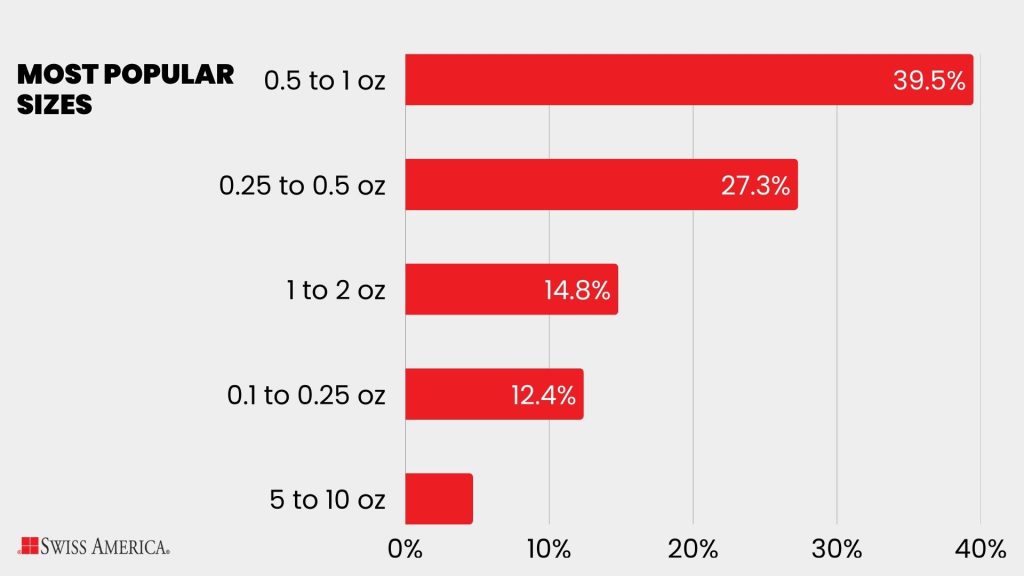
4) Most buyers chose sizes in the .5 to 1 oz range at 39.5%
The majority of customers chose mid-sized products in the .5 to 1 oz range. The next most purchased ranges were 0.25 to 0.5 oz and 1 to 2 oz, with very small and very large sizes less common.
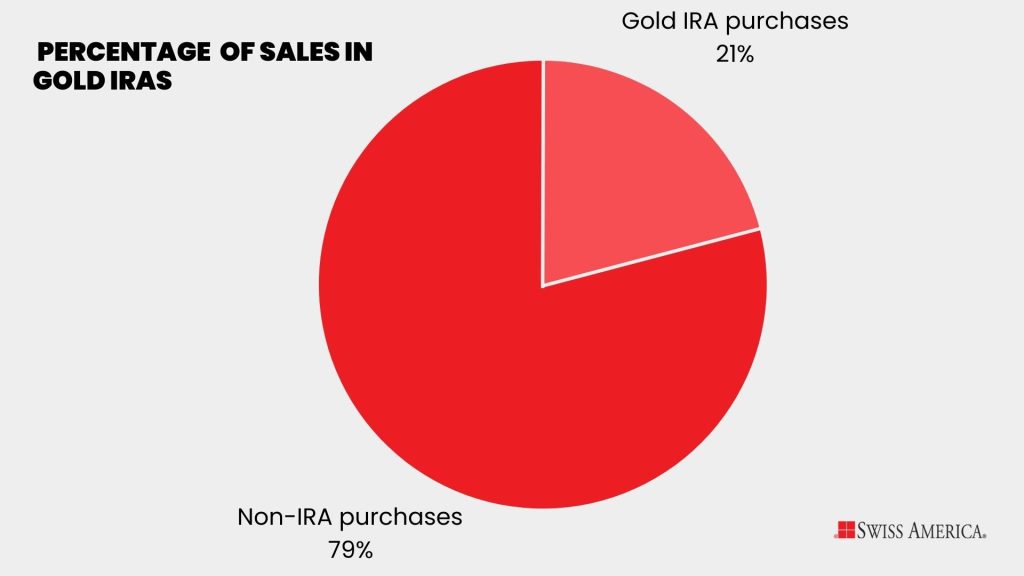
5) Gold IRAs represent 21% of all sales
Buyers leveraged their retirement funds at a rate of 21% of all sales. Most IRA orders occurred in the second and third quarters, which coincided with the rising price of gold.
Download a copy of the report
At-a-glance summary of gold demand trends:
| Category | What it includes | Why it’s useful |
| Demand | Monthly sales patterns, coins vs bars, regional sales, and precious metal choices | Gives a picture of precious metals sales trends from January to October 2025 |
| Products | Popular sizes and top-selling coins | Shows what investors bought the most |
| Gold IRAs | IRA usage, timing, and product choices | Explains how retirement accounts fit into the overall picture |
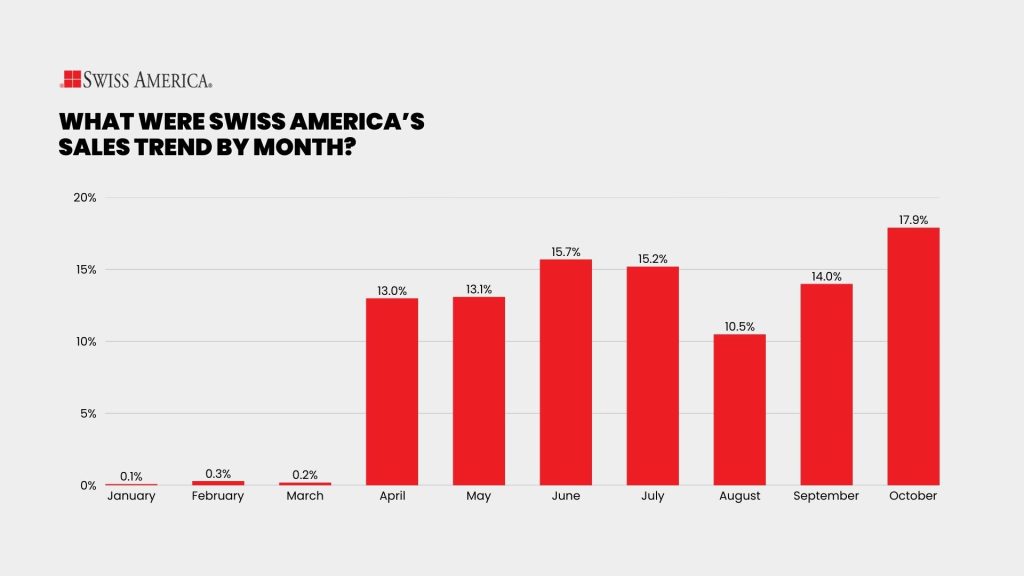
What are Swiss America’s sales trends by month?
Gold values rose in Q1, but we saw a low initial start to the year. The percentage of buying activity picked up in Q2, coinciding with Executive Order 14257, universal tariffs, and general overall uncertainty. April and May each reached 13%, and June rose to 15.7%.
July accounted for 15.2% of total sales, and August accounted for 10.5%. September reached 14% which is also when the Federal Reserve lowered interest rates for the first time since December 2024.
October has been the highest month of the year so far, at 17.9%, which aligns with the 25-basis-point drop in interest rates and when gold reached $4,000/oz for the first time.
- January: 0.1%
- February: 0.3%
- March: 0.2%
- April: 13.0%
- May: 13.1%
- June: 15.7%
- July: 15.2%
- August: 10.5%
- September: 14.0%
- October: 17.9%
Are coins or bars more popular?
The coin versus bar question comes up often. Most customers bought gold or silver coins in 97.6% of all transactions, while bars accounted for 2.4%.
- Coins: 97.6%
- Bars: 2.4%
Which regions buy the most precious metals?
The Northeast accounted for the largest amount of precious metal sales at 33.4%. The region also had the highest inflation rate as of September 2025. This may be part of the reason why buying activity is stronger there since inflation creates more interest in gold.
The Southwest followed the Northeast at 20.0%. The Midwest bought 17.5%, and the West reached 16.2%. The Southeast represented 12.9% of our total sales.
- Midwest: 17.5%
- Northeast: 33.4%
- Southeast: 12.9%
- Southwest: 20.0%
- West: 16.2%
Which metals are the most popular?
Gold is the most popular metal, representing 51.0% of all sales. Silver followed closely at 48.5%. There was a small amount of platinum at 0.46%, and palladium was the smallest share at 0.04%.
- Gold: 51.0%
- Silver: 48.5%
- Palladium: 0.04%
- Platinum: 0.46%
What percentage of all Swiss America’s sales are for Gold IRAs?
Ever since the Taxpayer Relief Act of 1997, we’ve seen continued growth in Gold IRAs. So far in 2025, these retirement accounts represent 21% of all purchases.
- Gold IRA: 21%
- Non-retirement: 79%
Which weights and sizes did customers buy the most?
The most common range was 0.5 to 1 oz at 39.5%. The next highest was 0.25 to 0.5 oz at 27.3%. Customers bought 1 to 2 oz products at 14.8%, and the 0.1 to 0.25 oz range was at 12.4%. Larger and very small sizes were less common, accounting for less than 5%.
Top 5 weights and sizes:
- 0.5 to 1 oz: 39.5%
- 0.25 to 0.5 oz: 27.3%
- 1 to 2 oz: 14.8%
- 0.1 to 0.25 oz: 12.4%
- 5 to 10 oz: 4.7%
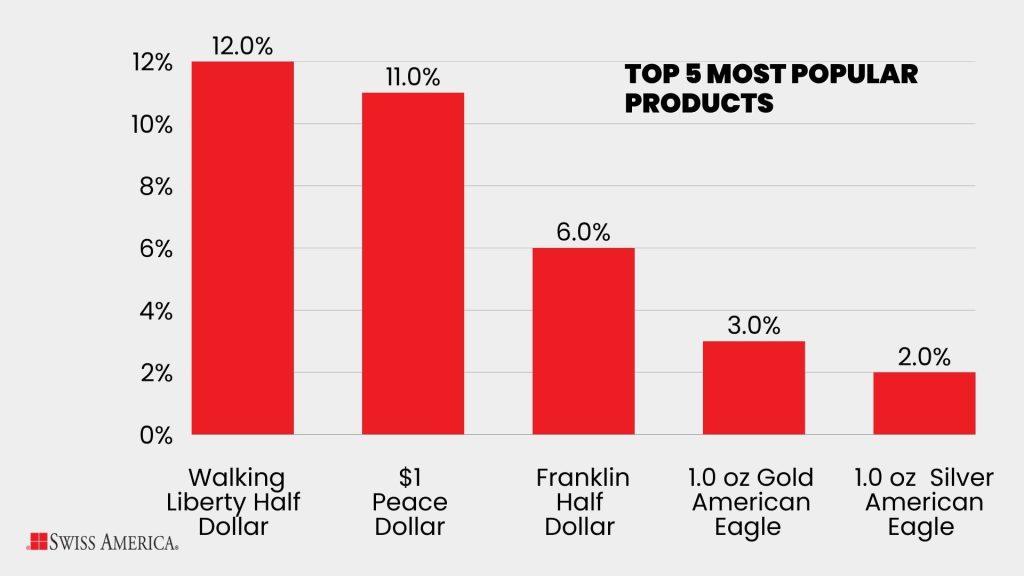
What are the top 5 most popular products?
The Walking Liberty Half Dollar is the most popular product, representing 12% of all sales. The Peace Dollar closely followed at 11%.
The Franklin Half Dollar was our third most popular gold coin at 6%. U.S. Mint coins rounded out the top five with the 1 oz Gold American Eagle at 3% and the 1 oz Silver American Eagle at 2% of all purchases.
- Walking Liberty Half Dollar (circulated): 12%
- Peace Dollar (circulated): 11%
- Franklin Half Dollar (circulated): 6%
- 1 oz Gold American Eagle Proof: 3%
- 1 oz Silver American Eagle Proof: 2%
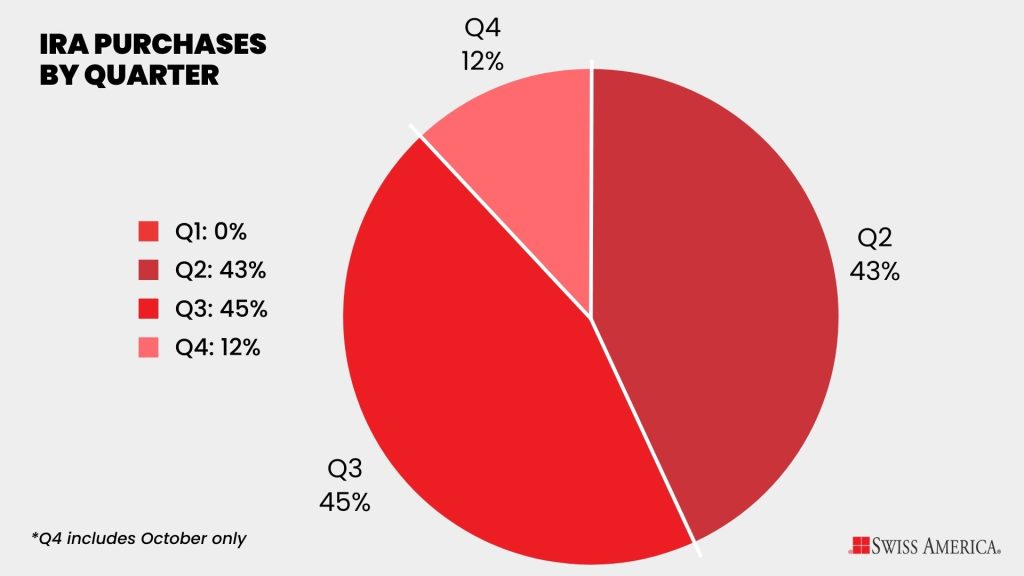
When did buyers make Gold IRA purchases?
Investors made Gold IRA purchases primarily in the middle of the year. Q2 accounted for 43% and Q3 for 45%. Q4 so far represents 12%.
- Q1: 0%
- Q2: 43%
- Q3: 45%
- Q4: 12%
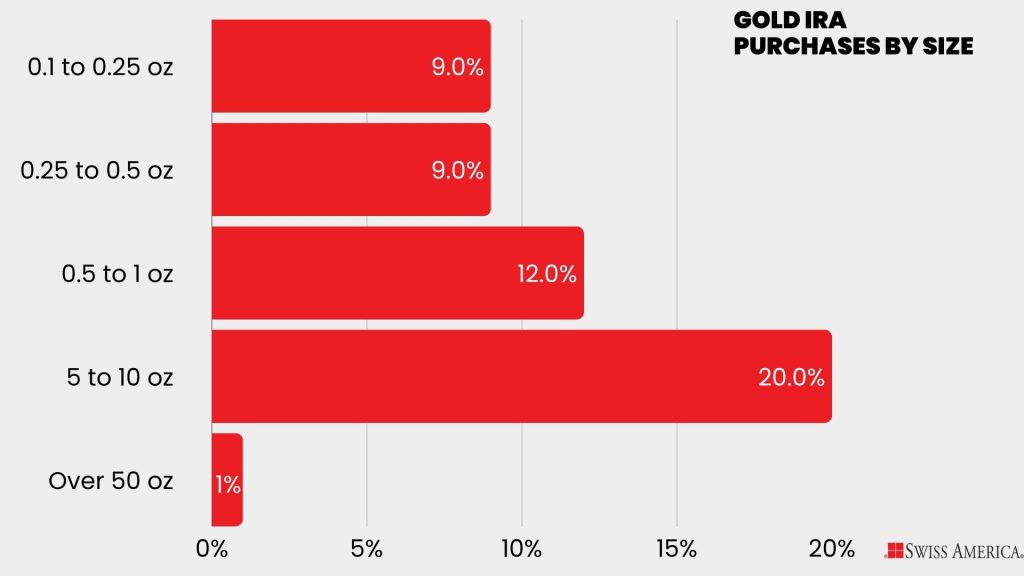
How are Gold IRA purchases distributed by size or weight?
Customers bought mid and larger sizes for their Gold IRAs. The 5- to 10-oz range was the highest at 20%. The 0.5 to 1 oz range was 12%, while both the 0.1 to 0.25 oz and 0.25 to 0.5 oz ranges were at 9%.
Only about 1% were larger amounts, like 50-oz bars.
- 0.1 to 0.25 oz: 9%
- 0.25 to 0.5 oz: 9%
- 0.5 to 1 oz: 12%
- 5 to 10 oz: 20%
- Over 50 oz: 1%
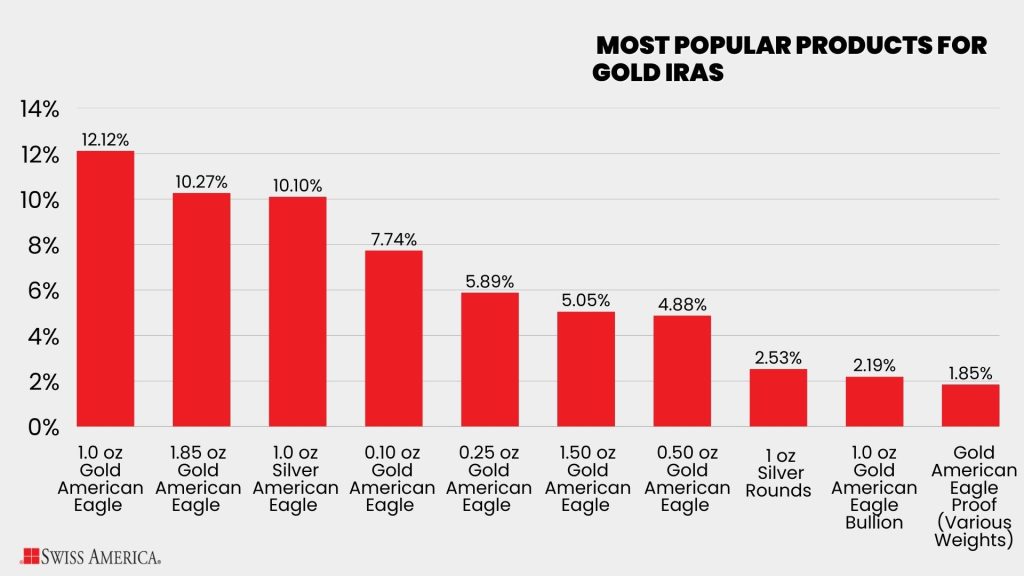
What are the most popular products for Gold IRAs?
The most common Gold IRA products are gold coins. The 1.0 oz Gold American Eagle was the highest purchased product at 12.12%. The 1.85 oz Gold American Eagle Proof followed at 10.27%, and the Silver American Eagle Proof was 10.10% of the total Gold IRA purchases.
Investors also bought the smaller Gold American Eagle Proof sizes, including the 0.10 oz at 7.74%, the 0.25 oz at 5.89%, the 1.50 oz at 5.05%, and the 0.50 oz at 4.88%.
Top 10 Gold IRA products:
- 1.0 oz Gold American Eagle Proof: 12.12%
- 1.85 oz Gold American Eagle Proof: 10.27%
- 1.0 oz SC1AE Silver American Eagle Proof: 10.10%
- 0.10 oz Gold American Eagle Proof: 7.74%
- 0.25 oz Gold American Eagle Proof: 5.89%
- 1.50 oz Gold American Eagle Proof: 5.05%
- 0.50 oz Gold American Eagle Proof: 4.88%
- Silver Misc Rounds Misc 1 oz: 2.53%
- 1.0 oz Gold American Eagle Bullion: 2.19%
- Gold American Eagle Proof (Various Weights): 1.85%
Conclusion
As the year winds down, the data shows how closely buyer behavior follows swings in consumer confidence and economic uncertainty. These conditions impacted demand and overall trends, ranging from the amount of gold or silver people can buy, whether they use retirement funds, and which regions were buying the most.
About Swiss America
Swiss America was founded in 1982 and built a reputation as one of the most trusted precious metals firms in the country. Over the past 40 years, we’ve guided more than 70000 clients on using gold and silver to diversify their portfolios.
The company is well-known for its personalized approach, professional support, and commitment to investor education.
The information in this post is for informational purposes only and should not be considered tax or legal advice. Please consult with your own tax professionals before making any decisions or taking action based on this information.